注意
转到末尾 以下载完整的示例代码。或者在浏览器中通过 JupyterLite 或 Binder 运行此示例
提供缩略图的图像#
此示例演示如何提供作为缩略图显示的图像。这是通过在示例文件中 docstring 下面的某个位置指定关键字-值对 sphinx_gallery_thumbnail_path = 'fig path' 作为注释来完成的。在此示例中,我们指定希望使用 _static 文件夹中的 demo.png 图像作为缩略图。
import matplotlib.pyplot as plt
import numpy as np

# sphinx_gallery_thumbnail_path = '_static/demo.png'
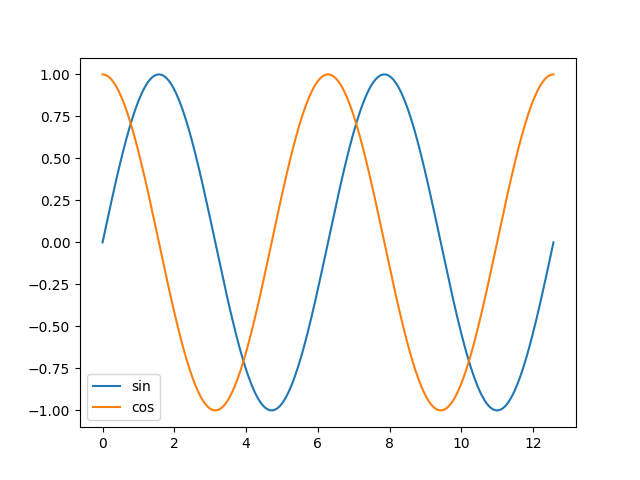
图 1#
plt.figure()
plt.plot(x, y1, label="sin")
plt.plot(x, y2, label="cos")
plt.legend()
plt.show()

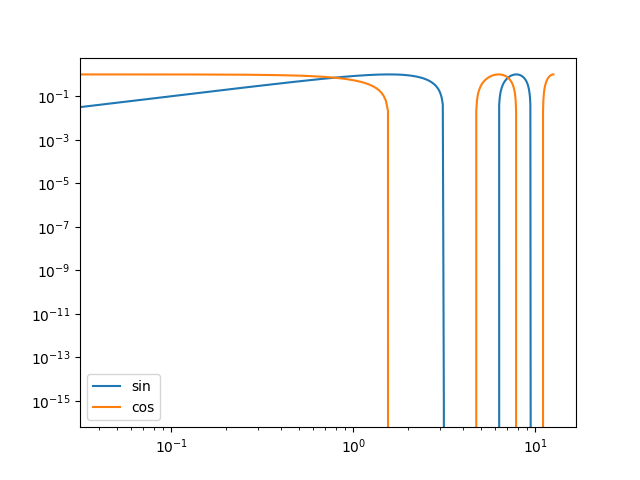
图 2#
plt.figure()
plt.plot(x, y1, label="sin")
plt.plot(x, y2, label="cos")
plt.legend()
plt.xscale("log")
plt.yscale("log")
plt.show()

脚本的总运行时间:(0 分钟 1.683 秒)
估计的内存使用量:176 MB