注意
转到结尾 下载完整的示例代码。 或通过 JupyterLite 或 Binder 在您的浏览器中运行此示例
Seaborn 示例#
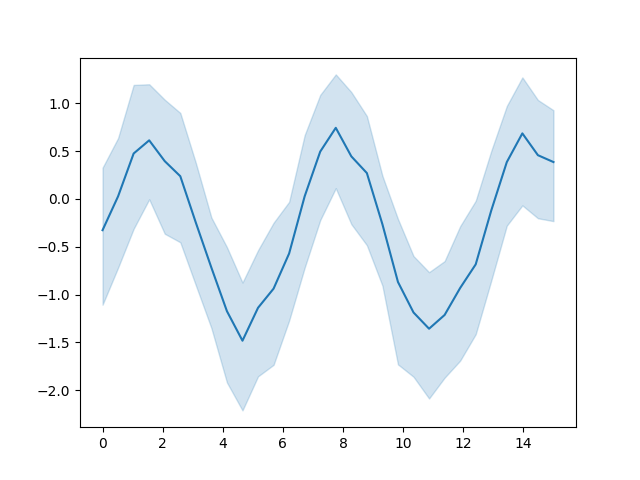
此示例演示了 Seaborn 图表。 默认情况下,由 Matplotlib 以及 基于 Matplotlib 的任何软件包(例如 Seaborn)生成的图形都将被捕获。 有关详细信息,请参阅 图像抓取器。

# Author: Michael Waskom & Lucy Liu
# License: BSD 3 clause

import matplotlib.pyplot as plt
import numpy as np
import seaborn as sns

# Enforce the use of default set style

# Create a noisy periodic dataset
y_array = np.array([])
x_array = np.array([])
rs = np.random.RandomState(8)
for _ in range(15):
    x = np.linspace(0, 30 / 2, 30)
    y = np.sin(x) + rs.normal(0, 1.5) + rs.normal(0, 0.3, 30)
    y_array = np.append(y_array, y)
    x_array = np.append(x_array, x)

# Plot the average over replicates with confidence interval
sns.lineplot(y=y_array, x=x_array)
# to avoid text output
plt.show()
脚本总运行时间: (0 分钟 1.945 秒)
估计内存使用量: 242 MB