注意
转到结尾 下载完整的示例代码。或通过 JupyterLite 或 Binder 在浏览器中运行此示例。
选择缩略图#
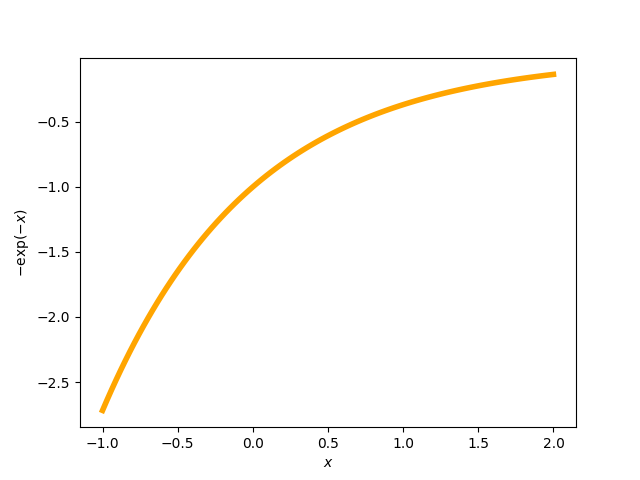
此示例演示了如何在示例生成多个图形时选择作为缩略图显示的图形。这可以通过在示例文件中的文档字符串下方某个位置指定关键字-值对 sphinx_gallery_thumbnail_number = <fig number> 作为注释来完成。在此示例中,我们指定希望第二个图形作为缩略图。
# Code source: Óscar Nájera
# License: BSD 3 clause

import matplotlib.pyplot as plt
import numpy as np


def main():
    """Plot expoential functions."""
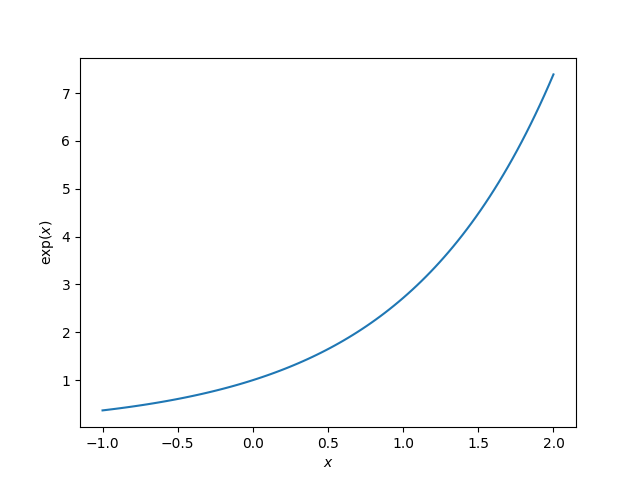
    x = np.linspace(-1, 2, 100)
    y = np.exp(x)

    plt.figure()
    plt.plot(x, y)
    plt.xlabel("$x$")
    plt.ylabel(r"$\exp(x)$")

    # The next line sets the thumbnail for the second figure in the gallery
    # (plot with negative exponential in orange)
    # sphinx_gallery_thumbnail_number = 2
    plt.figure()
    plt.plot(x, -np.exp(-x), color="orange", linewidth=4)
    plt.xlabel("$x$")
    plt.ylabel(r"$-\exp(-x)$")
    # To avoid matplotlib text output
    plt.show()


if __name__ == "__main__":
    main()
脚本总运行时间:(0 分钟 0.880 秒)
估计内存使用量:176 MB

