注意
转到末尾下载完整的示例代码。或通过 JupyterLite 或 Binder 在浏览器中运行此示例
绘制指数函数#
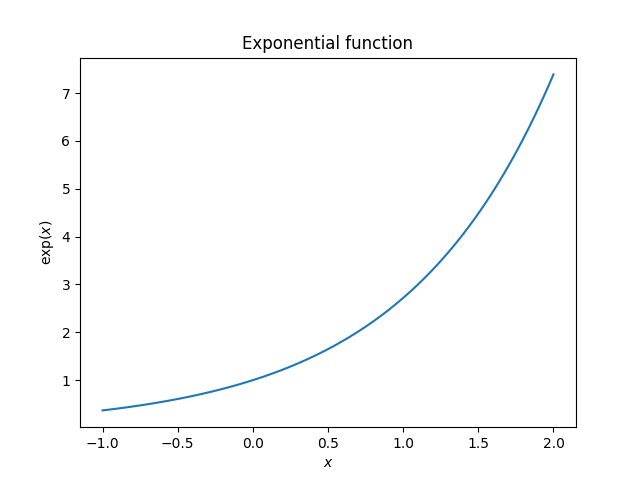
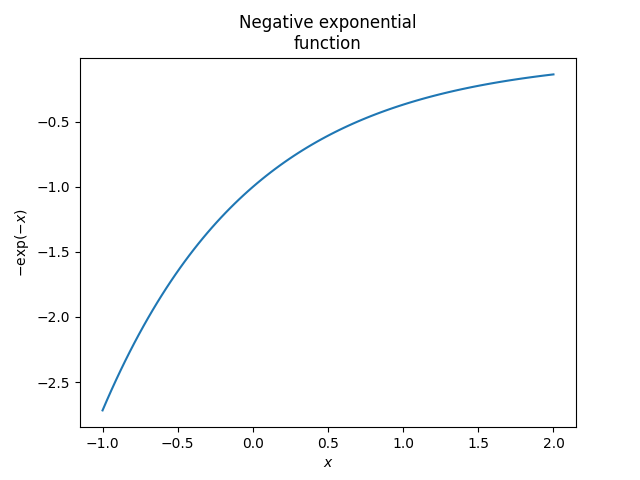
此示例演示如何导入本地模块以及如何在单个代码块中创建两个绘图时图像如何叠加(有关控制此行为的信息,请参阅 强制图在单独的行上显示 示例)。变量 N 来自示例“本地模块”(文件 local_module.py)在下面的代码中导入。此外,请注意,当示例中只有一个代码块时,输出出现在代码块之前。
# Code source: Óscar Nájera
# License: BSD 3 clause

import matplotlib.pyplot as plt
import numpy as np

# You can use modules local to the example being run, here we import
# N from local_module
from local_module import N  # = 100


def main():
    """Plot exponential functions."""
    x = np.linspace(-1, 2, N)
    y = np.exp(x)

    plt.figure()
    plt.plot(x, y)
    plt.xlabel("$x$")
    plt.ylabel(r"$\exp(x)$")
    plt.title("Exponential function")

    plt.figure()
    plt.plot(x, -np.exp(-x))
    plt.xlabel("$x$")
    plt.ylabel(r"$-\exp(-x)$")
    plt.title("Negative exponential\nfunction")
    # To avoid matplotlib text output
    plt.show()


if __name__ == "__main__":
    main()
脚本的总运行时间:(0 分钟 0.931 秒)
估计内存使用量:176 MB

